

The Trial Sheet tab in the app allows users to view they're In Treatment session progress in real-time as well as view Target graphs.
Jump to Section:
- Open desired Student Dashboard.
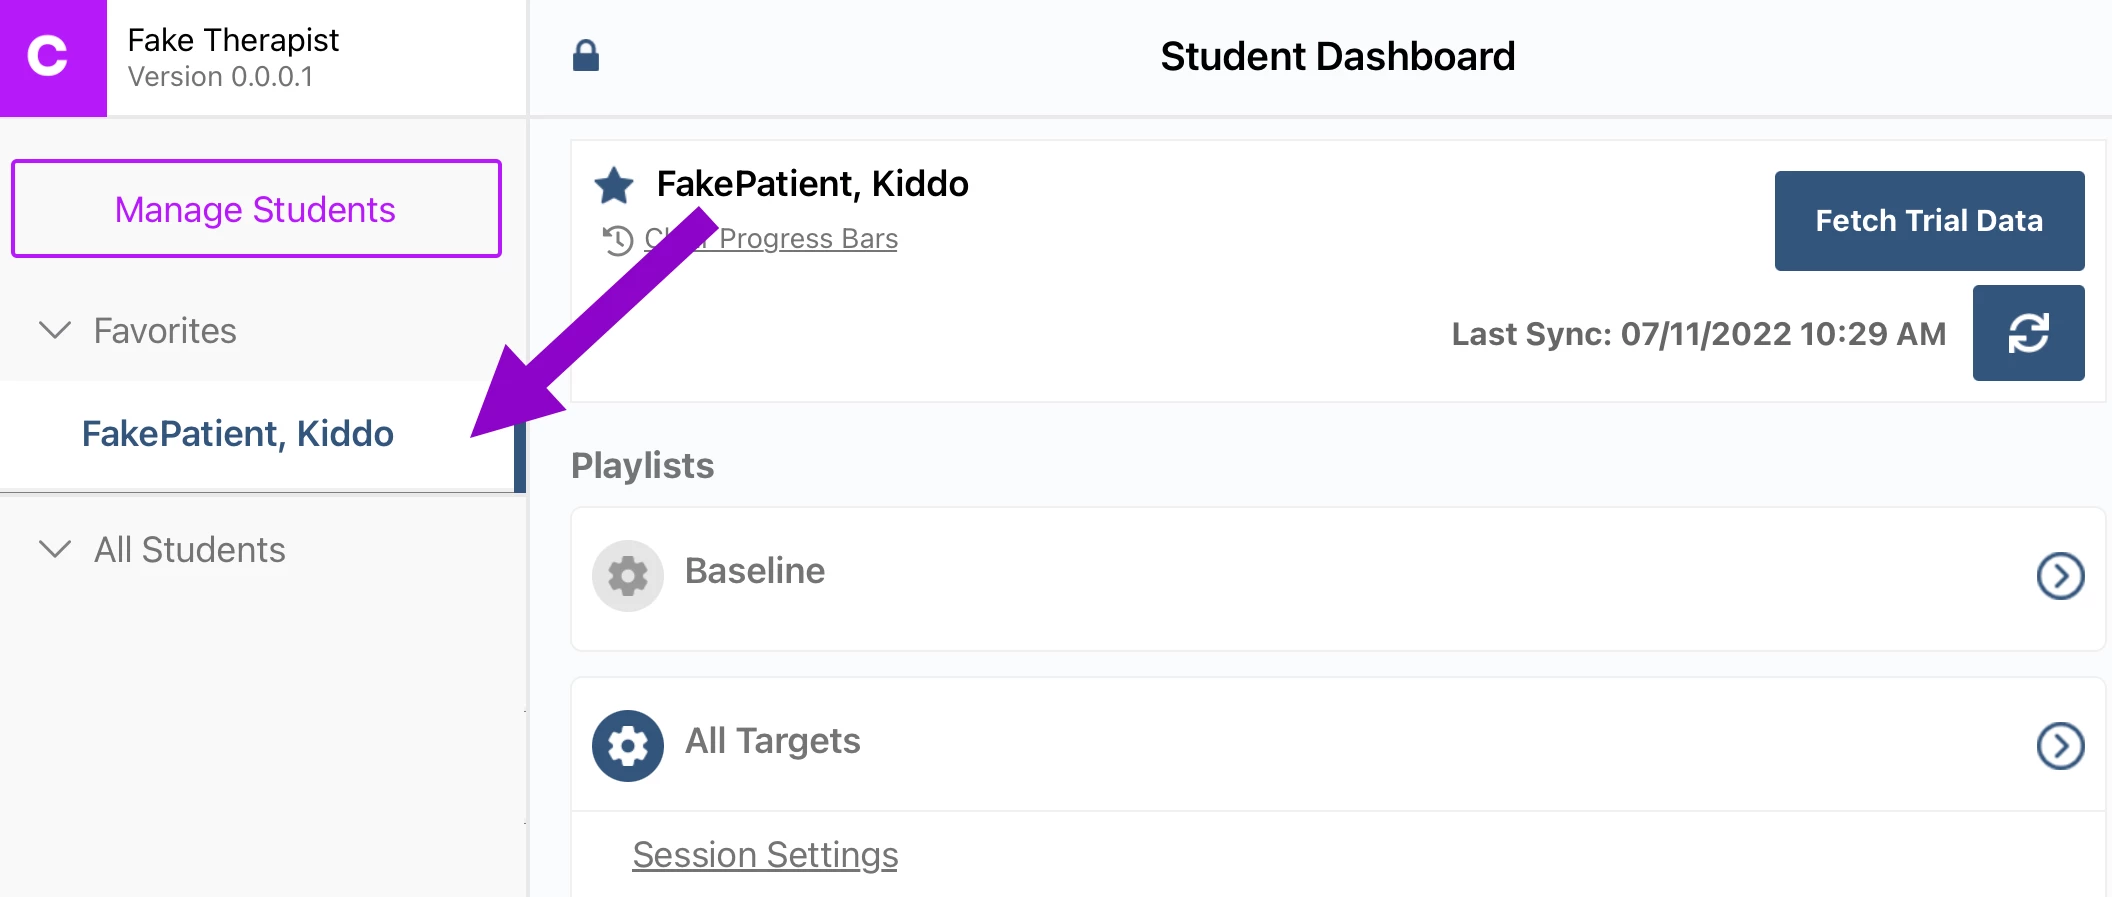
- Click the arrow for All Targets.
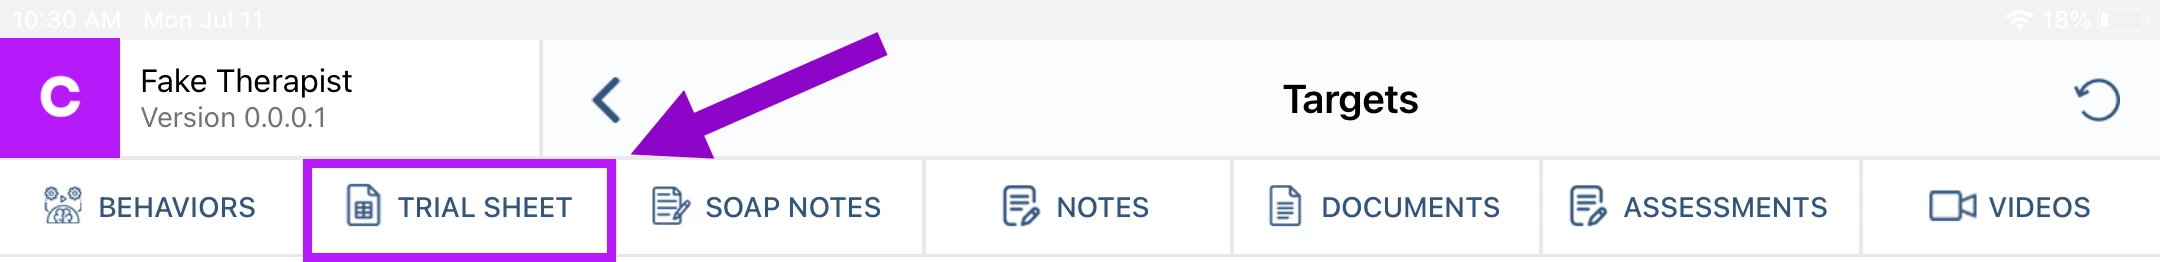
- Select the Trial Sheet button on the top menu.
Trial Sheet
View In Treatment session progress in real-time. It will not include Targets that are in Maintenance.
NOTE: The Trial Sheet in the app is not to be confused with the DTT Trial Sheet Report in the Student Section of the Portal. Different data will display in both Trial Sheets.
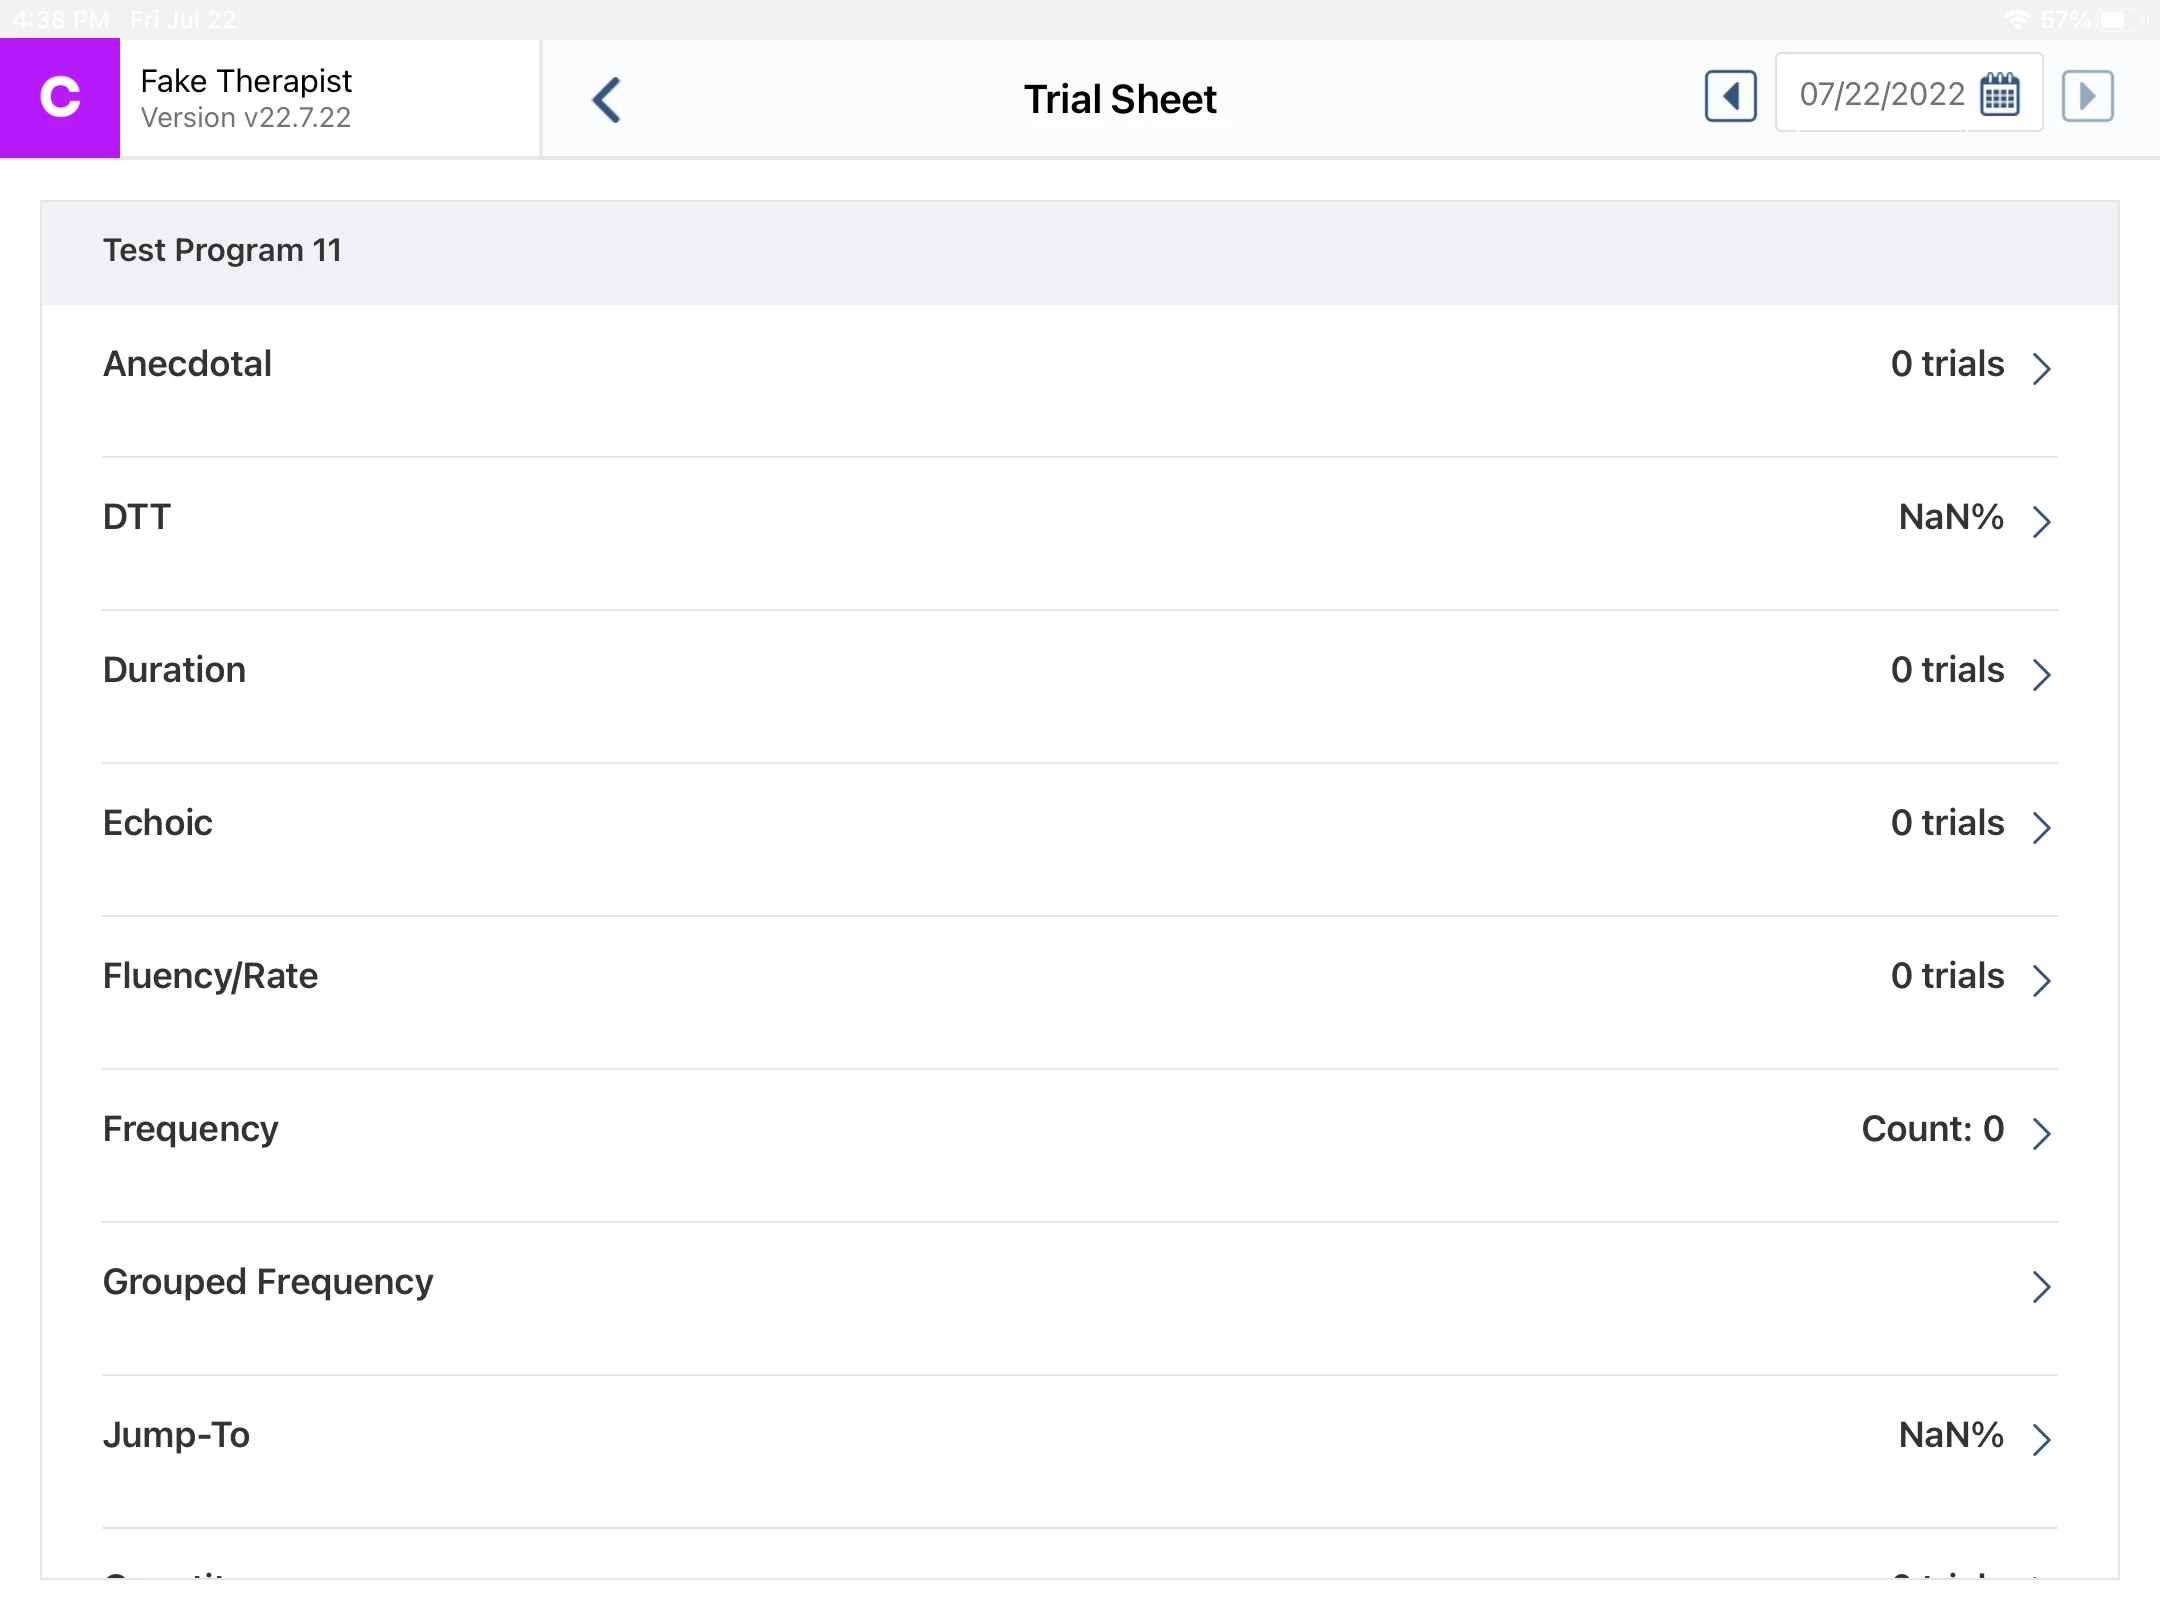
- Below is a Trial Sheet BEFORE a session begins.
NOTE: Some Target Types will show a percentage, and others will show the number of trials or counts.
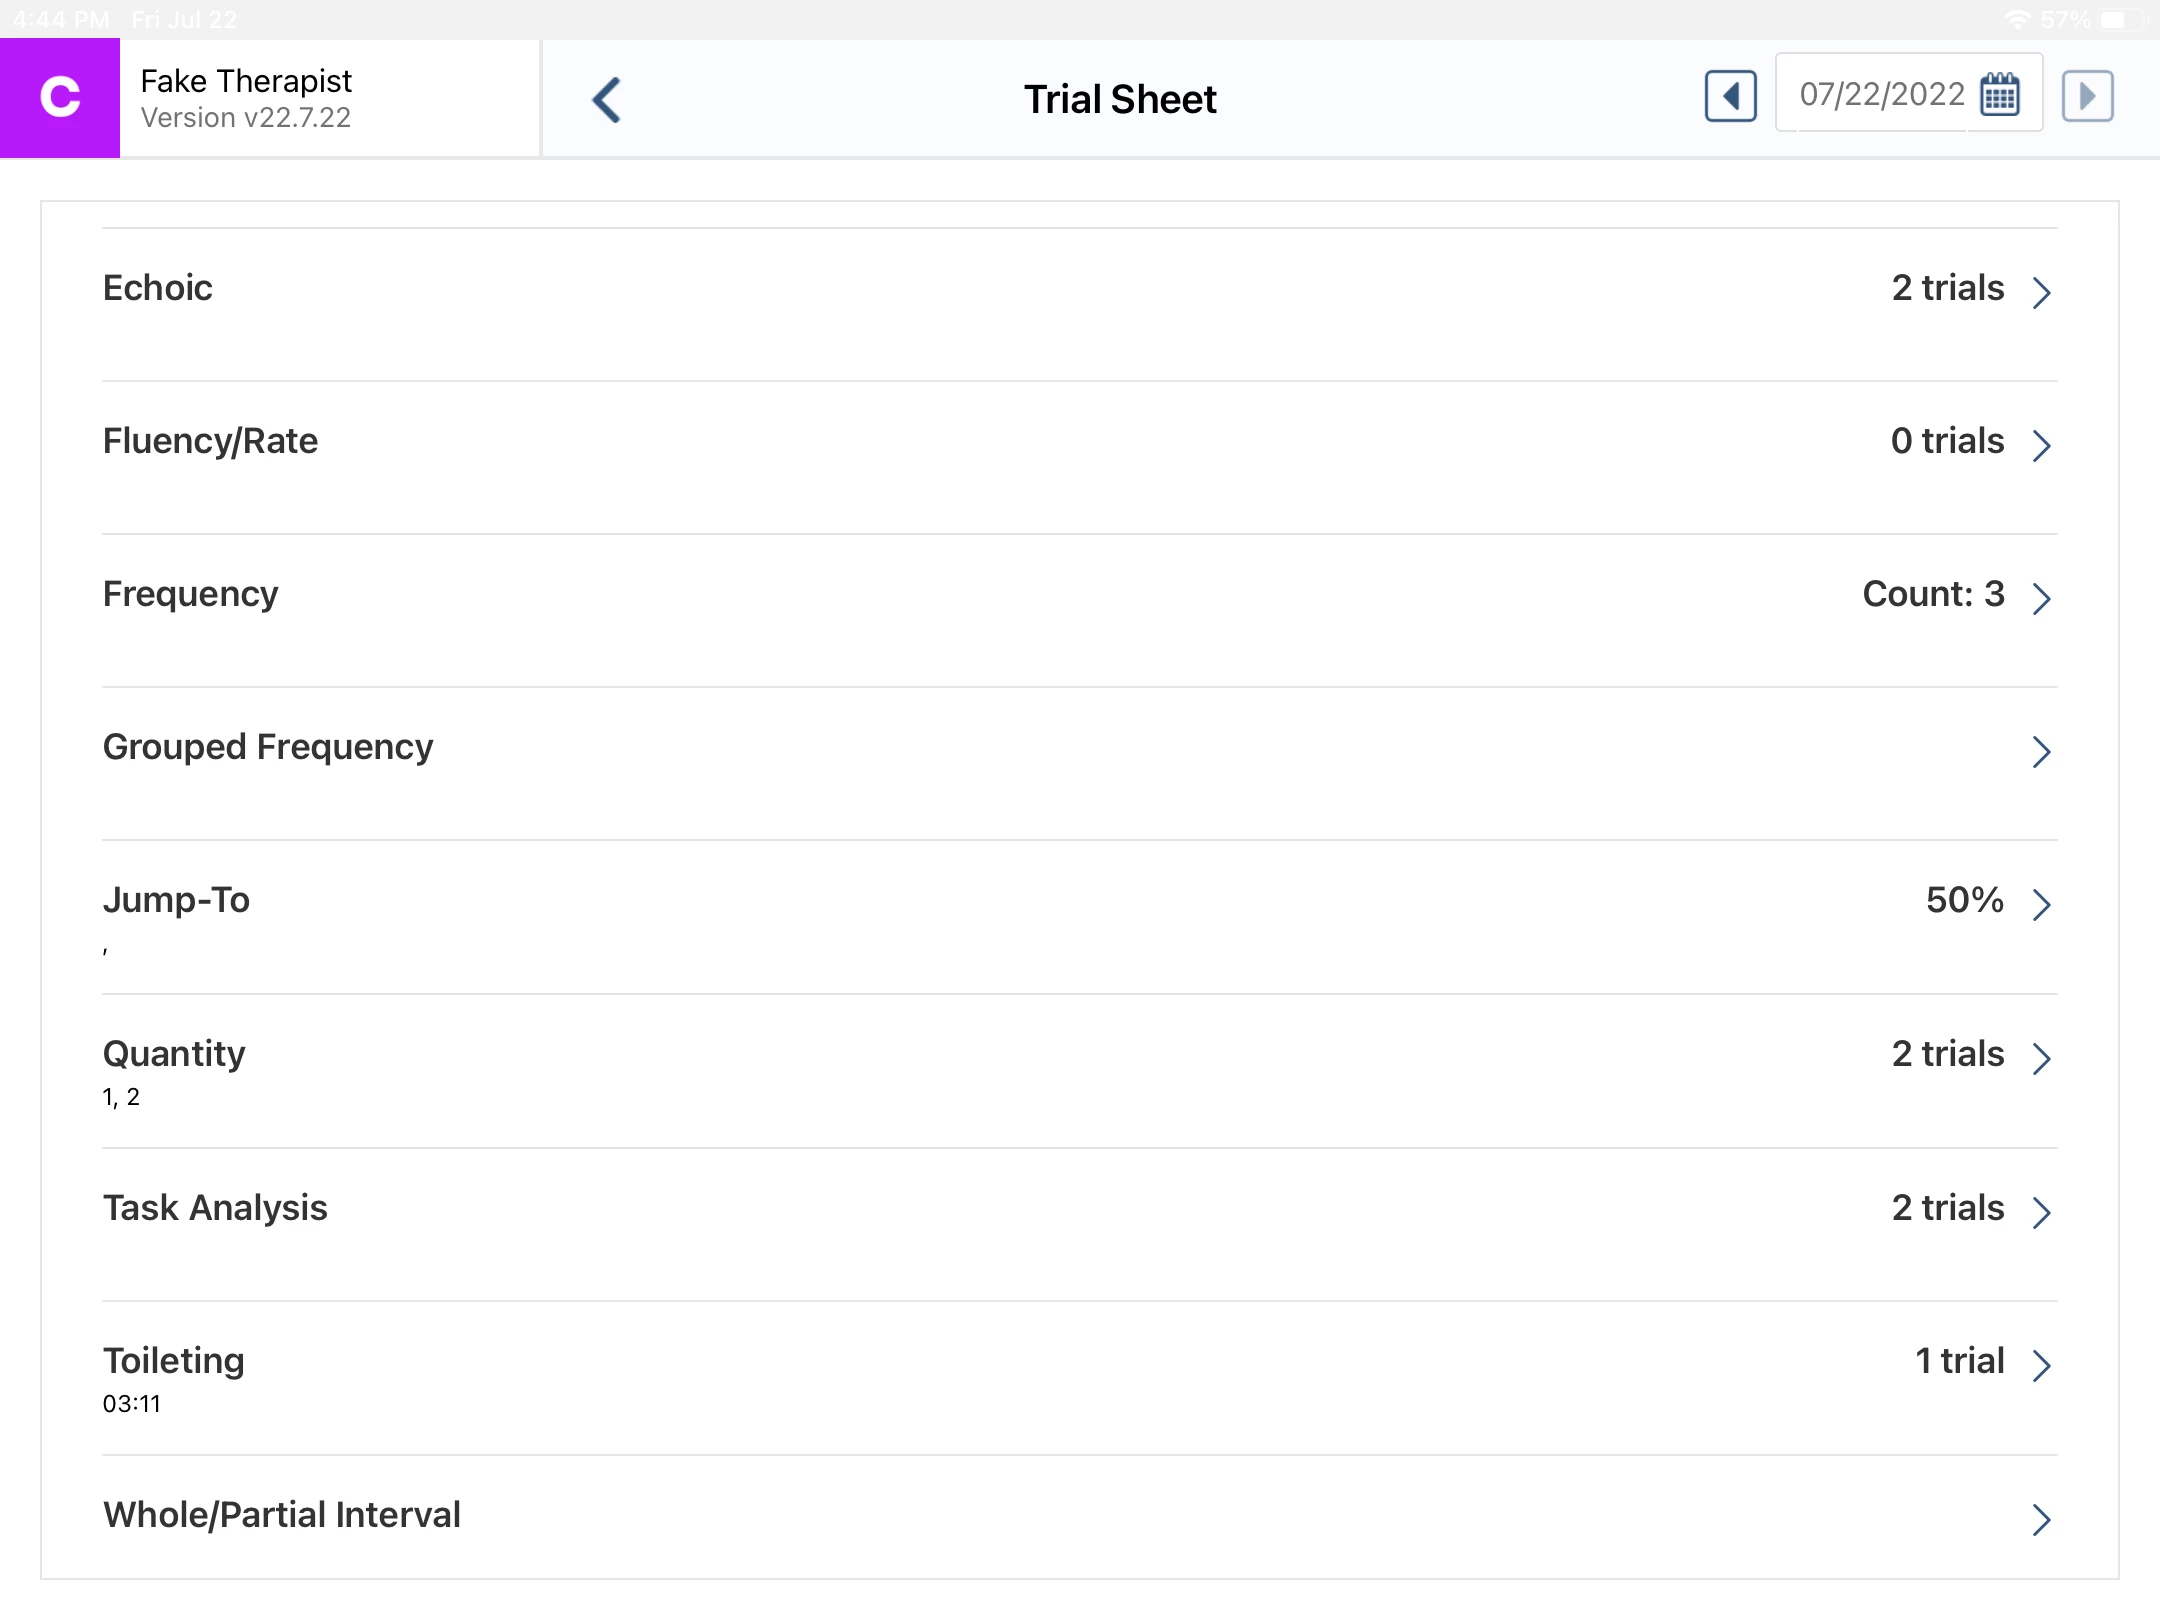
- Below is a Trial Sheet AFTER a session begins. Each Target Type displays data pertaining to that particular type.
[#top]
Target Graphs
IMPORTANT: Forms and Graphs can only be accessed on a tablet. They cannot be accessed on a mobile phone.
If accessing from a tablet device (iPad, Android tablet), users can view Target graphs from the app.
- Click the Arrow to the right of the desired Target in the Trial Sheet to display the Graph.
NOTE: The app must have an active WiFi connection in order to view Target Graphs on the app.
- The desired Target Graph displays. This will load the default graph for that Target and display the same options that are available when viewing Target Graphs in the Portal. To learn more about Target graphs and graphing options, please visit the Graphing Glossary documentation.
[#top]